 CFN – When I was the stat guy for the Habs way back in 1996 was Hockey Theory. I felt that essentially Hockey was the laying over of style templates and that depending on the template of the opponent that certain trends would become apparent.
And if you discovered those trends you could strategize against them. For example going into the 95/96 play offs against the mighty Mark Messier led Rangers the coaching staff was able to communicate enough of these that the Habs shocked the Rangers by winning the first two games. Examples of which were that Adam Graves would take about 65% of his shot attempts from one area of the ice, and that some of their older, slower d men liked to pinch.
Now some of those things the scouts saw too, but to quantify and document it was another thing.
Some of the other stat tools I created was a transitional tool that would abstract a players performance from one team in any league to any team in any league so for example when you had a Steve Maltais scoring 51 goals for the Chicago Wolves that would translate to only 19 goals on Montreal. And playing first line minutes with first unit PP time was unfortunately why Mr. Maltais was in the lower leagues.
It was a lot of fun and I got to submit reports on players that the Habs were mulling. I remember giving a huge push on Jarome Iginla who subsequently went on to have a mighty fine career.
What started me in stat work was listening to hockey on radio and watching on TV. Some names would be repeated by the announcers more than others and that was the impact of their play with the puck. I also had this goofy theory that if the puck was in the other guys zone more than yours good things would happen.
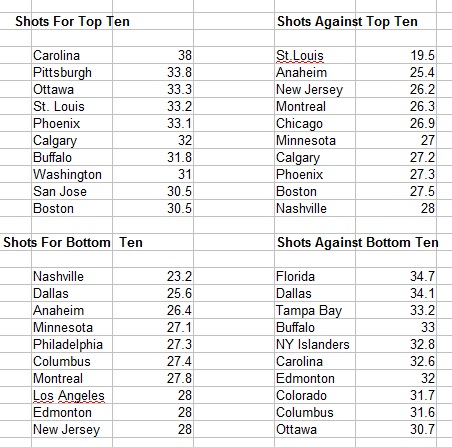
So with that said I put together the little chart above showing who’s taking shots and who’s not team wise. It’s not a huge sampling, but it is indicative of why it’s so important to put the frigging puck on the net!
While Kirk Muller’s ( Great guy, loved working with Kirk!) Carolina Hurricanes are taking a lot of shots they are also giving up a ton too which is why their being at the top of the charts hasn’t equaled wins yet. Same with quite a few of the other squads in the first chart. Again shooting is a good thing as long as you take more shots than you give up and then the quality of your players really comes into play when it comes to the results of shots for and against.
The Shots for Bottom chart clearly shows that if you don’t shoot enough you just don’t win enough. It was one of my issues with players like Alexei Kovalev and Andrei Kostitsyn while they were with the Habs. They just didn’t shoot enough to reach their potential.
Likewise the Shots Against Top Ten shows that if they shoot less on you they generally will score less which means if you score enough you win more games.
And the final chart clearly shows, with the exception of Ottawa whose goalie Craig Anderson’s exceptional play so far this year defies the abundance of work he’s had to do, that more shots on your goal equals more goals against which usually means you lose.
Shooting more while giving up less shots is magic and of course easier said than done. Over the course of a full season though trends do turn into results which is why you now are seeing smaller more mobile puck moving defensemen in the NHL get more opportunities and value.
Top Ten Shooters as of Feb 1 – Team Records in ()
Patrick Marleau 33 (7-0-0)
Phil Kessel 33 (4-3-0)
Zach Parise 30 (4-2-1)
David Clarkson 30 (3-0-3)
Sidney Crosby 29 (4-3-0)
Rick Nash 29 (3-4-0)
Tomas Vanek 28 (3-3-1)
Erik Karlsson 27 (5-1-1)
James Neal 27 (4-3-0)
Alexandre Burrows 27 (3-2-2)
Of course the Art of Statistics is abstract. You’re looking for threads of intelligence you can exploit. Injuries, slumps, scheduling, match ups, opportunity play a lot of roles, but at the end of the day he who shoots more on net will win the day.
What do you think Hockey fans? You can post your comments below.

